This article is intended users under the Basil Advanced plan. Basil Simple users can refer to this article.
Basil provides a comprehensive reporting feature designed to centralize and visualize client information. This feature allows you to view data in a spreadsheet format, and if there's enough information, Basil can also present the data in graph form.
Initially, only the Account Owner, Team Members, and Consultants with ‘View Reports’ permissions can see the Reports tab. Once custom reports are shared through the Report Builder, then the Reports tab will show for all other Team Members with ‘View Reports’ permissions. Primary Users and Client Users cannot see the Reports tab in Basil.
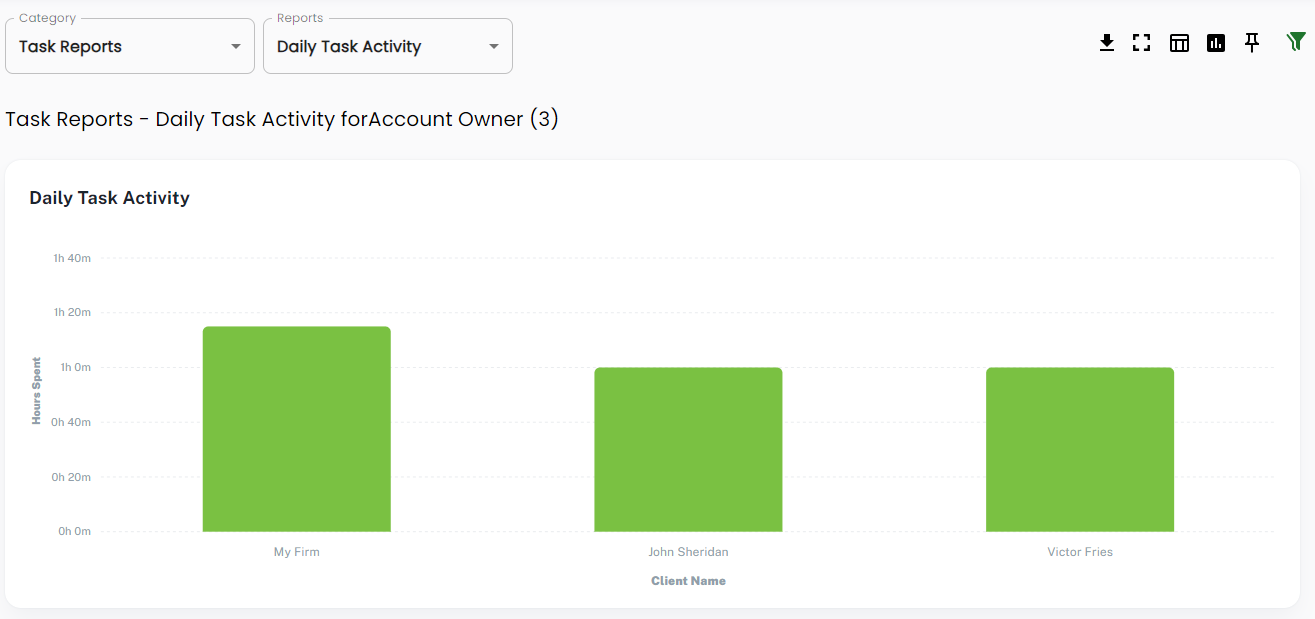
To start, click on the ‘Reports’ tab at the top of Basil. By default, you’ll be presented with all available data for the current period in the spreadsheet view.
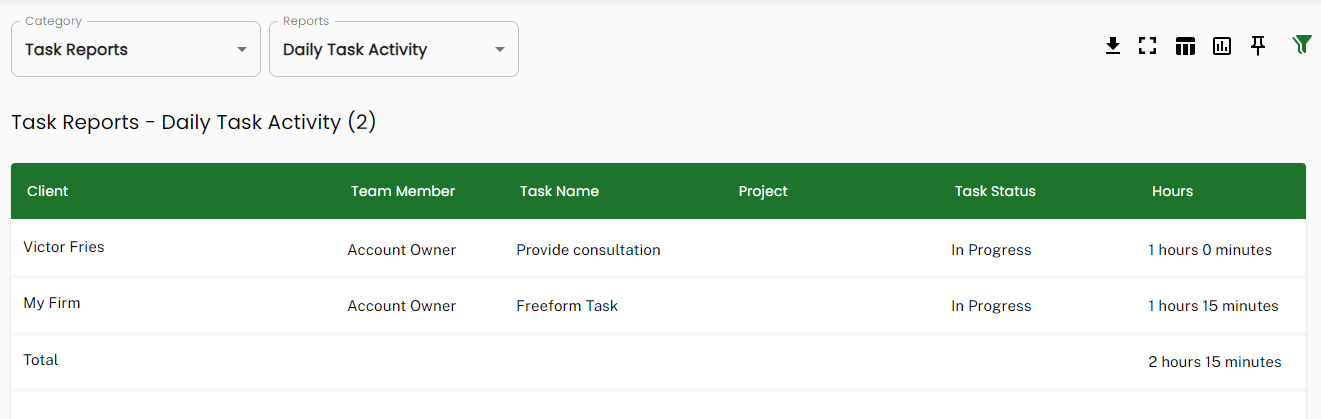
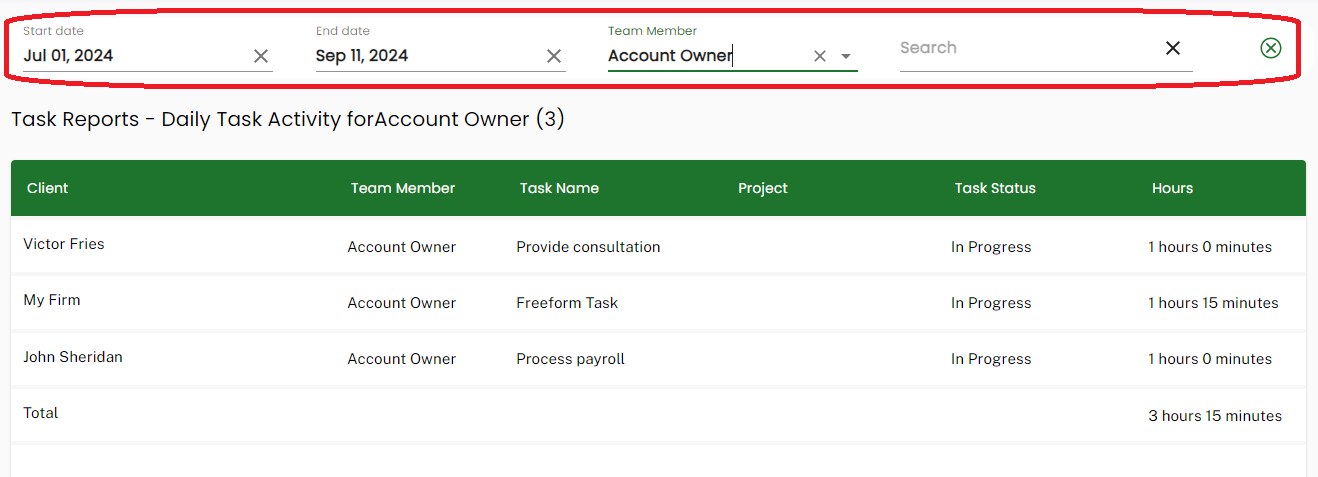
Just like the Tasks section of Basil, certain Reports will give you the ability to break them down further with filters. In this example, when we click on the funnel icon to the top right, the ‘Daily Task Activity’ report lets you filter by a specific Start/End date as well as by a specific Team Member.
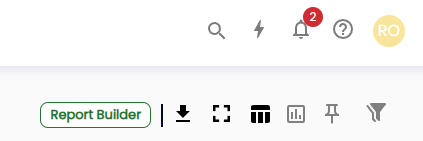
To the right of the filters, you have four additional options:
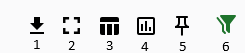
- Download the current spreadsheet report to a .CSV file
- Expand the current report (spreadsheet or graph) to full screen
- View the data in a spreadsheet view (default view)
- View the data in a graph view (if applicable)
- Pin or unpin the currently viewed graph to your Basil Dashboard Home screen
- Open the filters menu to filter the currently selected report
Clicking on the fourth option will display the data in a graph form if it is a report that a graph can be provided for.
Basil has various default reports available for the Account Owner to view. This is a list of currently available report categories and types of reports:
Time Reports:
- Hours Tracked by Team Member
- Unsubmitted Time by Team Member
- Actual vs Budgeted Hours
Task Reports:
- Daily Task Activity
- Outstanding Client User Tasks
- Outstanding Upload Links
Billing Reports:
- Aged Receivables Summary
- Aged Receivables by Client
- Revenue by Client
Timesheet Reports:
- Timesheet Summary
- Team Member Summary
- Category Summary
Recent Uploads Reports:
- Recent Uploads (for files)
The above default reports can be converted to custom reports by clicking the ‘Customize’ button on the top-right when viewing one.

Using the Report Builder:
Basil provides you a way to customize the reports shown in the Reports tab for you and your team to see.
Logged in as a user with ‘Manage Reports’ permissions, go to the Reports tab and click ‘Report Builder’ at the top-right.
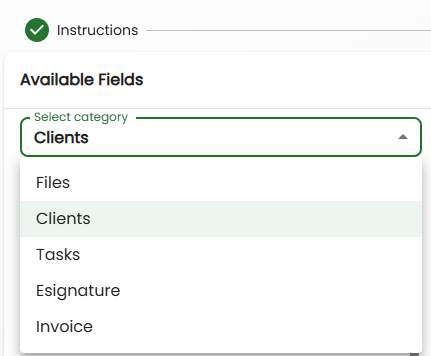
The ‘Instructions’ step will be shown. Click Next to go to the ‘Build Report’ step. For the ‘Select category’ selector, you can only select one of these per report. Once the report is built, it will be viewable in the selected category when viewing available reports in the Reports tab in Basil.
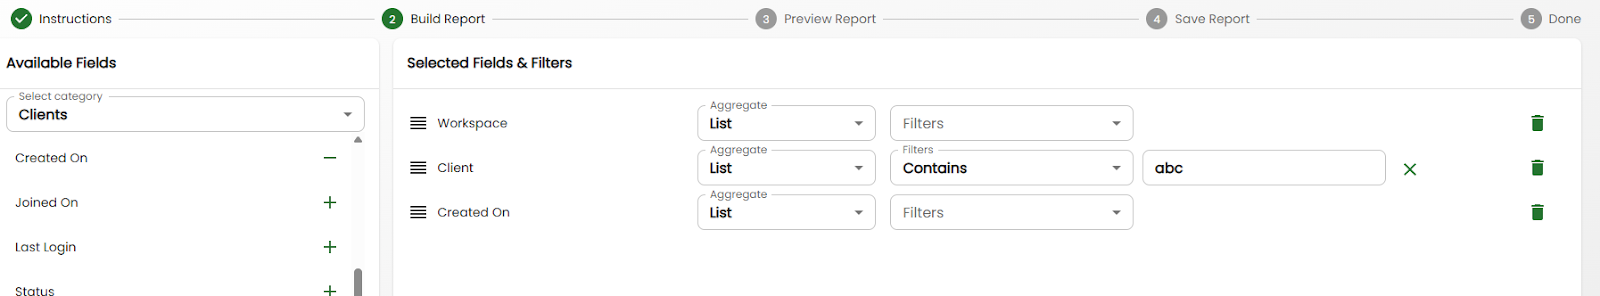
For each category, there will be many fields available for selection. Click the plus (+) button for each field to add to the report. For each field, you can add filters. To the left of each row in the ‘Selected Fields & Filters’ section, you can drag and drop the four horizontal lines to change the order of the fields.
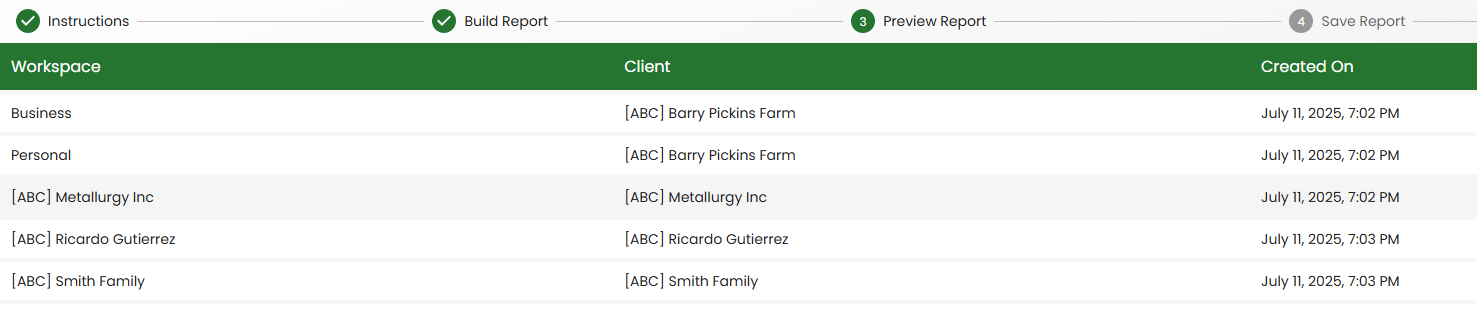
The below example shows a Client report that lists all Workspaces in Basil, along with all Clients with ‘abc’ in the name and the date when the Workspace was created.
The ‘Preview Report’ screen will only show the top few rows of the results. You will see the full results after the next step.
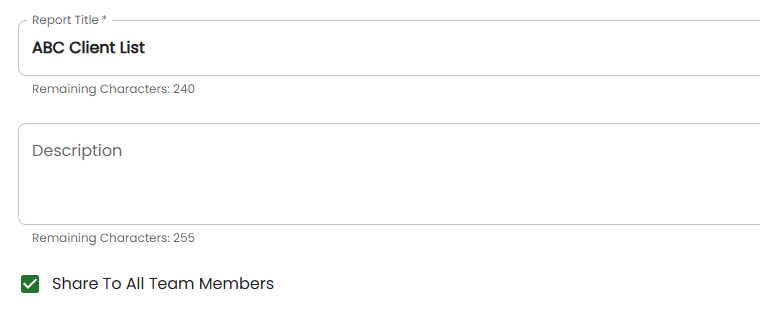
In the ‘Save Report’ step, add a name and enable ‘Share To All Team Members’ if you want your Team Members to be able to run the report from the Reports tab in Basil.
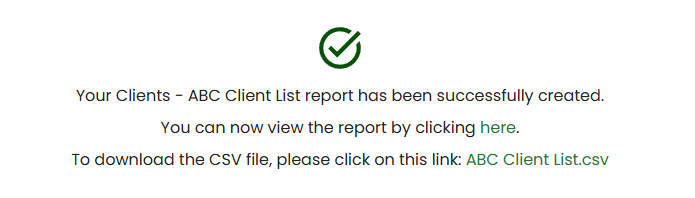
The ‘Done’ step will allow you to download the results right away by clicking the CSV file link.
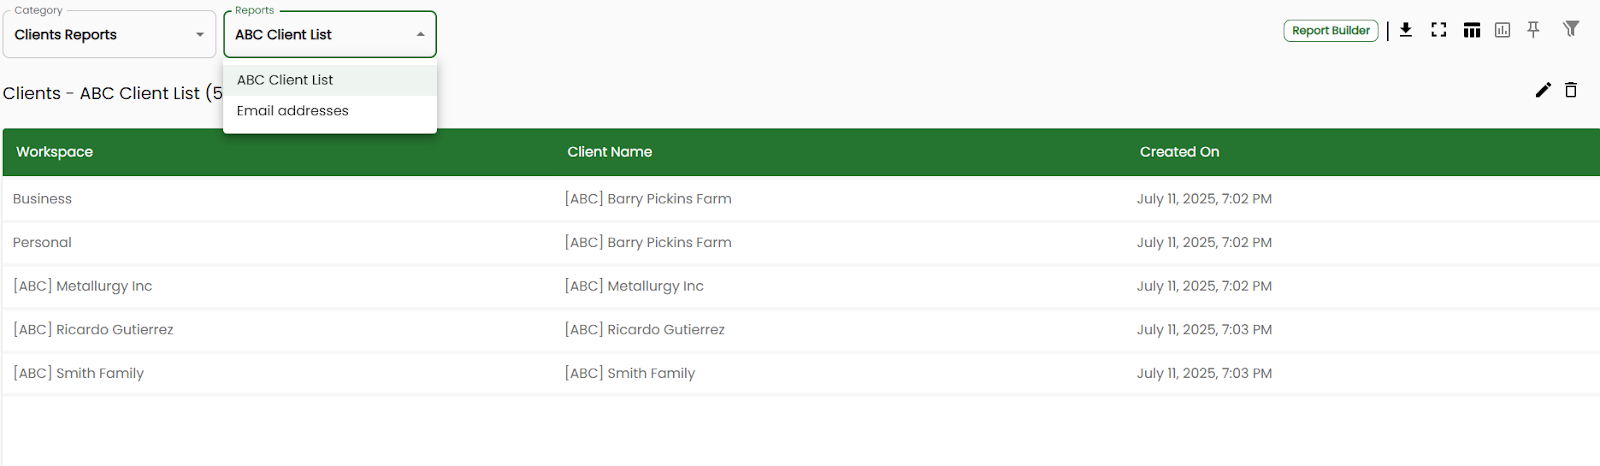
From the Reports tab, you can select the appropriate category to view your report. From there, you can use the button in the top-right to Download, view in FullScreen mode, edit the report, or delete the report.
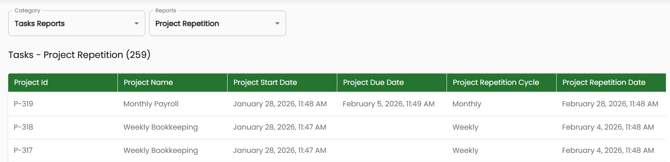
Building a Project Repetition Report using the Report Builder:
When making Projects with repetitions, it's useful to know when the next occurrence will be generated. You can build a Report to view those details.
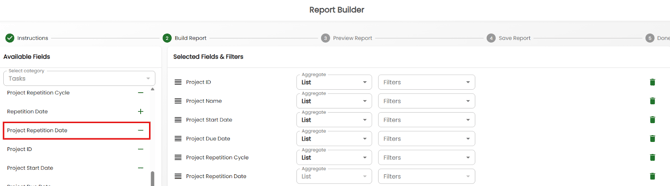
First, go to the Reports tab and click the Report Builder button on the top-right. Create a Report using the ‘Task’ category. Add the field ‘Project Repetition Date’, along with other fields that you prefer. See the image below for reference.
Click Next to see a preview, and click Next again to name the report. Proceed to finalize the report. You can then view the Report from the Reports tab by selecting the category ‘Tasks Reports’ and locate your Report name in the Reports dropdown. You can see each Project’s projected next occurrence creation/start date by seeing the ‘Project Repetition Date’ column.